Author:Used Wholesale Manufacturer TIME:2026-08-11
Second-hand shoe size-curve planning
There is no single second-hand shoe size mix for Africa. Countries, cities, customer groups, product categories, brands, marked size systems, outlet formats and price lanes differ. A buyer should build a local curve from coded sales and unmet requests, convert size systems without hiding ambiguity, trial a controlled order, allocate by channel and update the next mix from slow and missing sizes.
Define one planning cell narrowly enough to measure: for example, a specific city outlet format selling women's casual shoes in a stated price lane. Keep men's, women's, children's, sport, work, slippers and specialty categories separate until evidence supports combining them.
Do not describe a country or continent as one foot-size profile. The purpose of the cell is to attach every count to a real selling context and time period.
country and city
outlet format
product family
measured sales cycle
Capture sold pairs, days to sale, requested-but-unavailable sizes, customer substitutions, returns or refusals where available and stock exposure. Keep condition and price lane beside the size so a slow pair is not blamed on size alone.
Use consistent codes and train outlets to report missing demand, not only completed transactions. A zero sale with zero stock is not evidence of low demand.
size and time
requested without stock
accepted adjacent size
reason recorded
Record the size exactly as marked and the stated system when known. Use an approved conversion reference for planning, but preserve brand, model, gender or youth context and the original label. Conversions can be approximate and construction affects fit.
Create an unknown or manual-review field for worn, conflicting or ambiguous marks. Do not force uncertainty into the nearest convenient band.
mark and system
approved mapping
category and construction
visible exception
The notebook keeps the original mark, market signal and next-order action in one line.
| Evidence field | Record by | Interpret with | Next-order use |
|---|---|---|---|
| Sold pairs | Cell, category and marked size | Stock exposure and days | Protect active bands |
| Missing requests | Requested marked size | Availability and substitutions | Test under-supplied bands |
| Slow stock | Band and outlet | Condition, style and price | Reduce only supported excess |
| Unknown marks | Pair code and image | Approved conversion review | Set an exception allowance |
| Transfers | Origin and destination | Final selling cell | Revise outlet allocation |
The curve becomes more reliable when each change can be traced to a market cell and an observable signal.
Group usable sizes into practical bands for the defined cell, then calculate a proposed share from current stock, sales, unmet requests and the buyer's risk limit. Keep exact counts behind the summary bands.
Set a target range rather than a false precise percentage where second-hand supply varies. Add maximum concentration, minimum useful quantity and a rule for rare or extreme sizes.
usable planning group
range not false precision
over-concentration limit
rare-size route
Choose a quantity small enough to learn but large enough to expose the planned bands. Require pair-level or bundle-level size coding and category separation so received stock can be compared with the target.
Record supplier variance before accepting the trial. Allocate sizes across selected outlets according to their cell rather than sending the same ratio everywhere.
bounded learning lot
size and category
disclosed before release
outlet-specific share
At arrival, verify bale or carton identity, seals, moisture signs, pair compatibility, original size marks and counts by planning band. Separate unreadable labels and mismatched pairs from the usable curve.
Issue an outlet allocation sheet with size, category, condition and quantity. Keep transfers visible so later sales are credited to the outlet and cell that actually sold the pair.
identity and condition
original mark and band
outlet allocation
destination history
After a defined cycle, compare exposure, sales speed, missing requests, substitutions, transfers, markdowns and remaining stock by cell and band. Investigate condition, style and price before assigning the cause to size.
Revise only the fields supported by evidence and retain the previous curve for comparison. A useful update states which band changed, by how much, for which cell and why.
pairs offered
time to sale
missing demand
dated reason

Provide category, original marked systems accepted, target bands, ranges, concentration caps, unreadable-label rule, pair compatibility limits, packing codes and sample count format. Ask what current stock can realistically supply.
Require the supplier to disclose substitutions and out-of-range stock before packing. The next order should use local results, not a copied country percentage or an unsupported claim about African demand.
bands and ranges
accepted systems
traceable counts
pre-approved variance
No. Build separate evidence for country, city, channel, category and customer group.
No. Preserve the original mark and flag uncertainty in the conversion.
Use a bounded quantity that can test the planned bands without exceeding the buyer's risk capacity.
No. Condition, style, price, exposure and outlet allocation can also explain slow sales.
Target ranges, size systems, caps, coding rules, sample counts and an exception route.
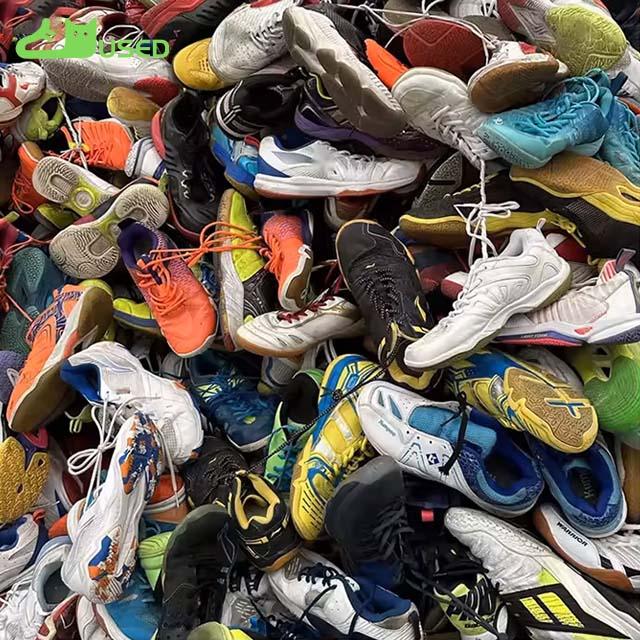
A second-hand shoe size mix becomes useful when it belongs to a measured local cell. The used mixed shoes wholesale category is the relevant supply family; original size marks, outlet allocation and dated feedback shape the next curve.

Direct Factory Supplier of Used Shoes For African Markets In China
 Tel: +8618606960861
 Email: info@usedshoeswholesale.com
 MP/WhatsApp: +8618606960861
 Manufacturer Address:Cizao Town, Jinjiang City, Quanzhou City, Fujian Province